
EdgeRater BLOG
Stock Market Analysis for Successful Traders
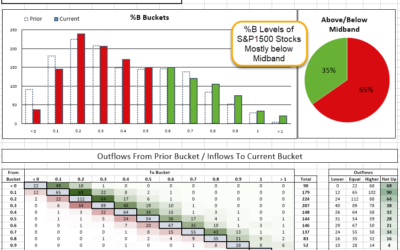
%B Bucket Migration
The %B Migration report shows how the various stocks within the selected symbol list are moving between %B Buckets.

RSI PowerZones Signals and Backtesting
The book 'Buy The Fear Sell The Greed' by Larry Connors contains 7 behavioral quant strategies for traders. This post reviews the first strategy in the book named 'RSI PowerZones' and shows how to view strategy signals and how to backtest along with backtest results....

Guppy Multiple Moving Average Indicator and Template
The book "Trend Trading, A seven step approach to success" by Daryl Guppy examines in detail the steps in finding, assessing, selecting, managing and monitoring a long-term trend trade. Amazon Book Link: http://a.co/1AMLULl A core part of the approach is the use of a...

Trends and Snapbacks using the CCI Indicator
The CCI (Commodity Channel Index) is a versatile indicator that can be used for many different types of trading (Trends, Reversals, Continuation plays, Cycles, etc). Originally Donald Lambert invented CCI to be used as a breakout indicator: a long entry signal is...
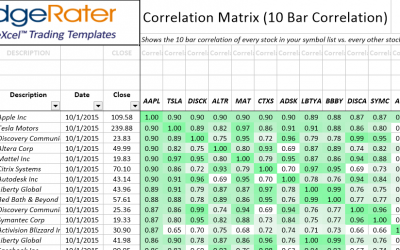
How to find Correlated Stocks and Alpha, Beta values
What is Correlation? Correlation is a measure of how one security moves in relation to another. A correlation value of 1 means that Stock A is exactly Correlated with Stock B. Take a look at the following charts of Amazon (AMZN) and Facebook (FB) for example: You can...
Seasonality Trading
What is Seasonality Trading? The idea behind seasonality trading is to find specific times of year when a stock consistently trends upwards or downwards. Seasonality doesn't attempt to identify why a stock moves at a particular time of year, just that it does and does...
Dividends and Backtesting
When backtesting it is important that the data you use is adjusted for splits and dividends. The necessity of adjustment for splits is more obvious due to the larger effects on price. For instance if a stock is trading at $40 and gets a 2:1 split, it suddenly appears...
Subscribe