
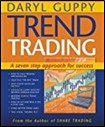
 The book “Trend Trading, A seven step approach to success” by Daryl Guppy examines in detail the steps in finding, assessing, selecting, managing and monitoring a long-term trend trade.
Amazon Book Link: http://a.co/1AMLULl
A core part of the approach is the use of a multiple moving average indicator called the Guppy Multiple Moving Average (GMMA) which consists of a series of 6 shorter term exponential moving averages viewed together with a series of 6 longer term exponential moving averages. This indicator helps determine the nature of the trend. Daryl guppy explains that using single moving average crossovers to detect trend entry points is not very successful as different stocks have different characteristics and a ‘one size fits all’ type of approach doesn’t work.
Using multiple moving averages arranged into two groups provides more information to inform a better decision. The shorter term group of exponential moving averages is known as the ‘Traders’ group and reflects the more active response that traders have to stock price movement. The longer term group of exponential moving averages is known as the ‘Investors’ group and reflects the actions taken by core position holders and institutions.
Here’s an example of the GMMA plotted on a chart:
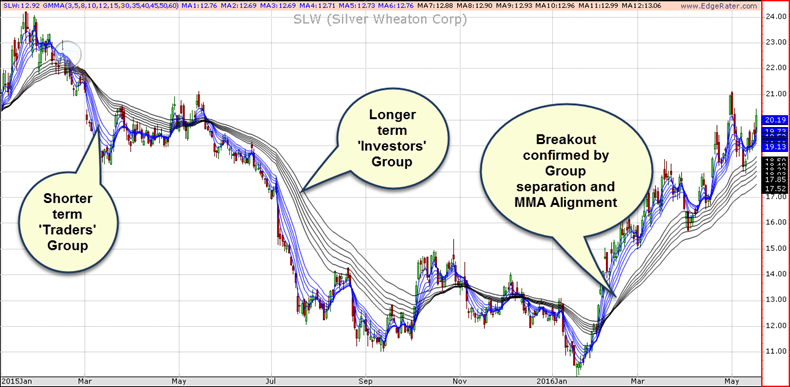
There are several things to watch for to determine the character of a trend:
- Are the traders above or below the investors?
- Is there separation between the two groups?
- Is there compression within a group?
- Are the moving averages within a group aligned?
- What is the slope of each group?
Compression refers to the individual moving averages within a group coming together as time progresses. Alignment refers to whether the individual moving averages within a group are oriented correctly with respect to each other. For instance, in an uptrend, is the shortest moving average above the next moving average and so on. Actually, Guppy does not refer to alignment in his book but I have found it to be a useful characteristic that helps measure the trend.
There are many nuances to trend trading and the book walks the reader through numerous scenarios dealing with breakouts into a new trend and pullbacks within a trend. He shows how you can best determine if a breakout is real or false and how you can tell if a pullback will find support among investors. For people interested in hitching a ride on a trend this book is well worth a read.
Of course, once you read the book you will want to apply the GMMA to current charts and scan the market for opportunities. That’s where the new ‘Guppy Multiple Moving Average Template’ comes in. The template is this month’s addition to the ever growing collection of EdgeRater trading templates.
Here’s an example of the report produced by the template:
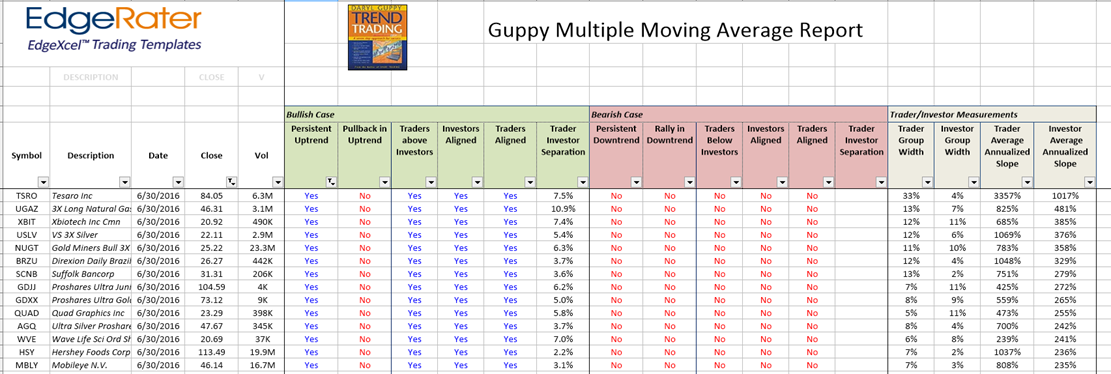
It is organized into 3 sections: Bullish Case, Bearish Case and Trader/Investor Measurements.
Here’s the Bullish Case section in more detail:
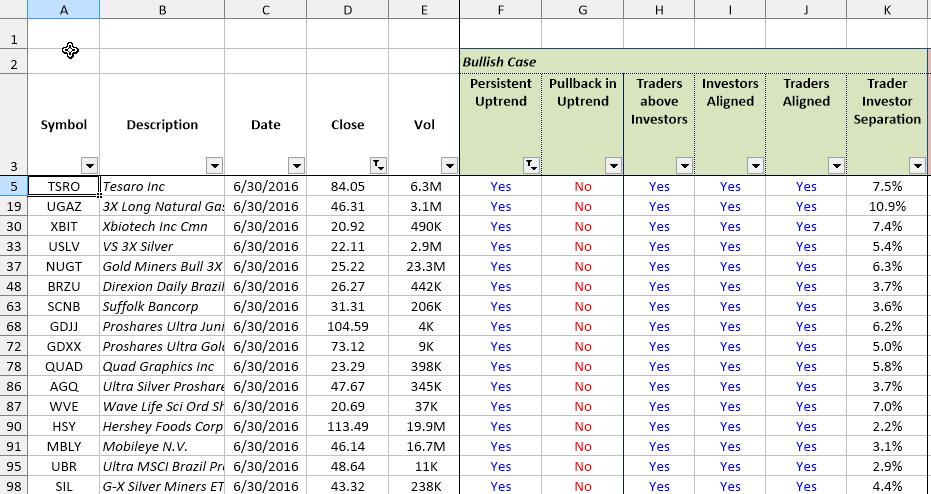
You can see in columns H, I and J 3 of the conditions that we are interested in:
- Traders above investors: ‘Yes’ if the Trader group of MMAs are completely above the Investor group
- Investors Aligned: ‘Yes’ if all 6 Investor moving averages are aligned, meaning that the shortest MA is above the next shortest and so on.
- Traders Aligned: ‘Yes’ if all 6 trader moving averages are aligned.
The ‘Persistent Uptrend’ column is ‘Yes’ if all 3 of the columns H, I and J are true. Clicking on the header brings all yeses to the top of the list allowing quick access to the charts.
The ‘Pullback in Uptrend’ column is ‘Yes’ if Traders are above investors and investors are aligned but traders are not aligned. This attempts to highlight stocks that have firm investor support but are being sold by traders potentially offering better buying opportunities for investors.
The ‘Trader/Investor separation’ measures the % difference between the lowest moving average in the traders group and the highest moving average in the investors group.
The ‘Bearish Case’ section is the inverse of the bullish case and attempts to locate good shortable downtrending stocks.
The final section is the Individual group measurements:
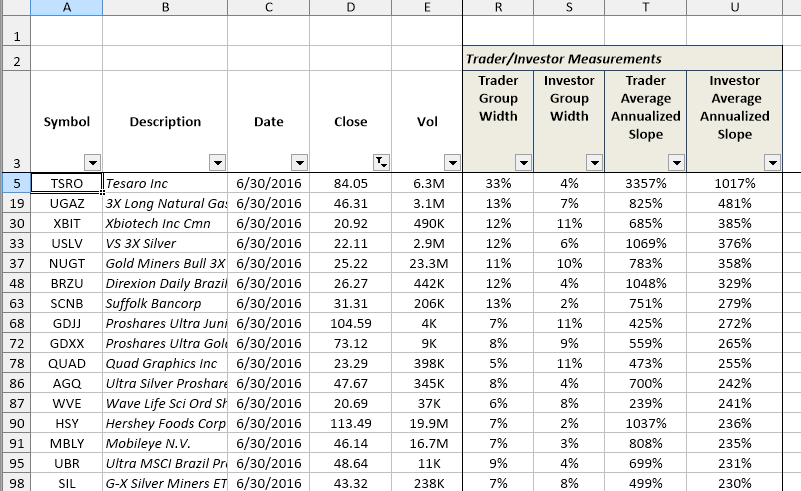
Trader Group Width measures the distance in % from the highest to lowest moving average in the Traders group
Investor Group Width measures the distance in % from the highest to lowest moving average in the Investors group
Trader Average Annualized slope measures the average slope of the trader group of moving averages. This is expressed in annualized % terms meaning that if the slope continued for 1 year the stock would gain the listed % amount
Investor Average Annualized slope measures the average slope of the investor group of moving averages. This is expressed in annualized % terms meaning that if the slope continued for 1 year the stock would gain the listed % amount
You can filter the slope columns to find stocks that are increasing more steadily or more rapidly. For instance, applying a filter for the investor group slope of between 100% and 300% will show a selection of more steadily rising stocks.
The template can be found in the template library under the ‘Hot Topics’ category. To run it, just select the template, select a list of stocks and press Run. Once the report has been produced you can double click on any row to bring up a chart showing the stock. The report is automatically linked to the GMMA chart.
If you find a stock to your liking you can click ‘Add To Favorites’ to add it to your own personal watch list for easy access in the future. You can add a note to that entry too. Keeping track of all stocks that you discover in template reports this way allows you to easily remember where they came from and why you liked them. It is a great tool to help you be more successful in your trading.