
 In the September and October 2010 issues of Technical Analysis of Stocks and Commodities, Ron Black presented the Clear Method as a way to determine the direction of short term price swings. It is an indicator that works “in all time frames, requires no calculation, and has no delay“. It is based on the statistical idea that when two distributions overlap no change has likely taken place and that when they don’t overlap it is likely something has changed. Please read the referenced articles for all the details.
This post shows how to use the Swing Line indicator in EdgeRater to detect these directional changes and also how to use the EdgeRater template ‘Ron Black, Clear Method’ to get a comprehensive Clear Method report of all stocks, detailing:
- Exactly when the swing direction has changed
- How long the current swing has lasted
- How much noise there has been in the current swing
- how frequently the swing direction changes
- how much noise there has been in multiple time periods
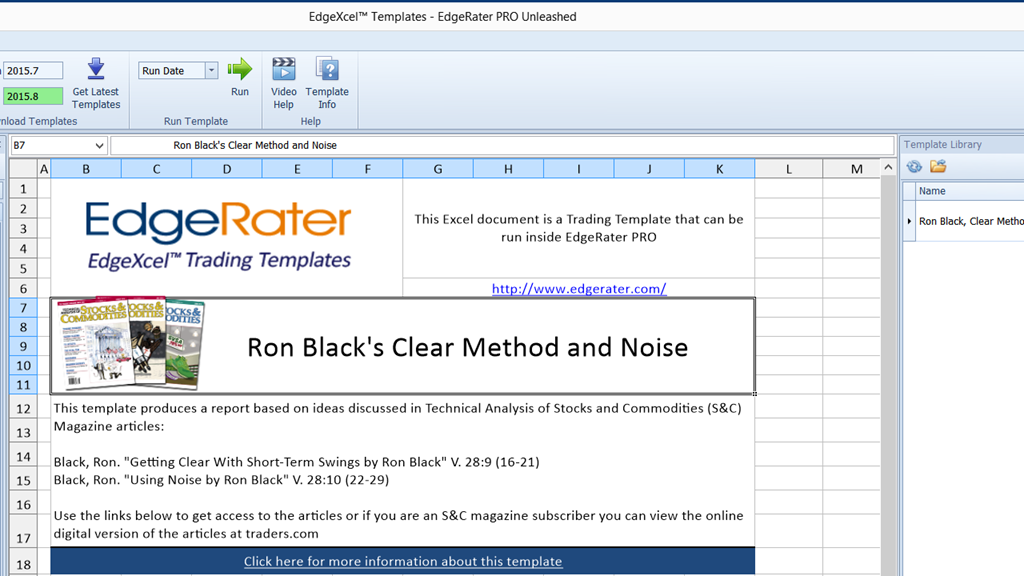
Article References
Black, Ron. “Getting Clear With Short-Term Swings”, Technical Analysis of Stocks and Commodities Sep. 2010: V.28:9 (16-21)
Black, Ron. “Using Noise”, Technical Analysis of Stocks and Commodities Oct. 2010: V.28:10 (22-29)
How to find the Articles
If you have a subscription to S&C magazine you can find the articles online in the complete digital archive at traders.com
You can subscribe to the magazine (which includes access to the complete digital archive and over 30 years of articles) with the following link:

Subscribe and get access to entire digital archive
Or you can read just the two individual articles without subscribing:
 Article 1: Getting Clear With short term Price Swings
 Article 2: Using Noise
In the referenced articles you will find code for implementing the main indicator of the method which is called the Swing Line. If you are an EdgeRater user the Swing Line is already included in the program.
The Swing Line
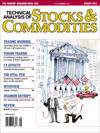
The Swing Line traces the Highest Lows in an up swing and Highest Highs in a down swing and is the demarcation line that a stock has to completely cross (and clear) in order for a new swing direction to occur.
In EdgeRater you can add the SwingLine to the main chart area by dragging it from the ChartScript Library and dropping it on top of the stock price bars.
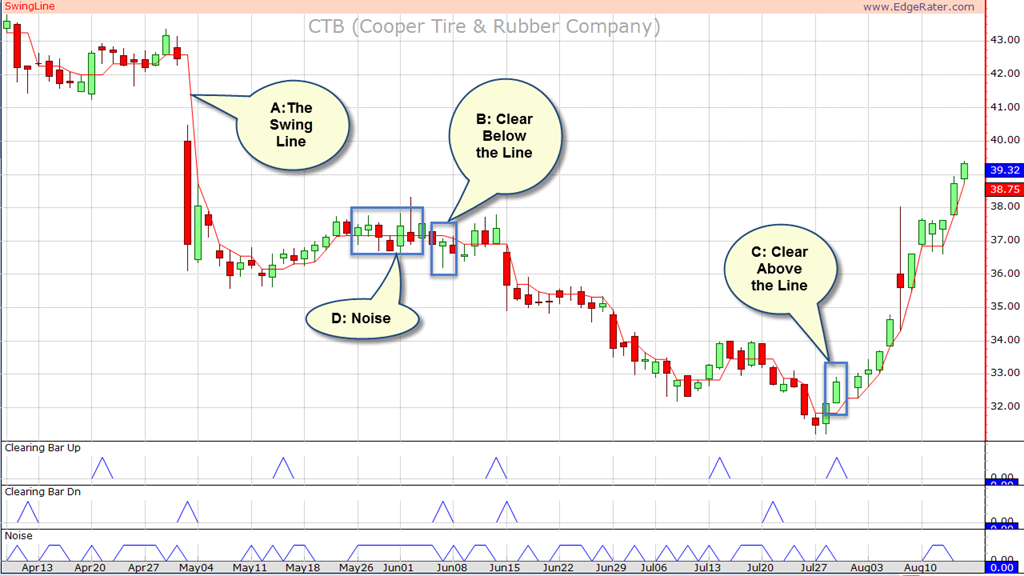
Chart showing the Swing Line, Clearing Bars and Noise Bars
To determine if a stock has changed direction (based on the clear method) you just need to look at where the current OHLC range is in relation to the Swing Line (A)
If a stock is in an up swing, you detect a new down swing by looking for the first bar where the high of the bar is completely below the Swing Line (B).
If a stock is in a down swing, you detect a new up swing by looking for the first bar where the low of the bar is completely above the Swing Line (C).
If a stock price bar straddles the Swing Line there is no new direction information (previous direction is still in effect) and there is Noise (D).
In the above chart you can also see 3 lower sub areas which depict the Up, Down and Noise bars.
How to Produce a Clear Method Report
The Template
The EdgeRater Template “Ron Black, Clear Method” can be found in the template library under the category “S&C Magazine”:
The Clear Method template is in the S&C category in the Template Library
As with any template in EdgeRater, you can run it to produce a report by selecting the template from the library, choosing a symbol list and then pressing ‘Run’ in the Menu.
Press ‘Run’ to produce a report from the Clear Method Template
The Report
The template produces a report which can be viewed within EdgeRater (the default) or externally within Microsoft Excel. If you view the report in EdgeRater you have the added benefit of being able to view a stock chart of your currently selected stock as you scroll through the report. The stock charts are automatically linked to a chart layout that contains the Swing Line and the 3 sub areas showing Clearing Bars Up/Down and Noise. You can choose to show your own chart layout instead if you wish by turning off template linking within the chart.
Download a sample report in .xlsx format
Here’s the first section of the report:
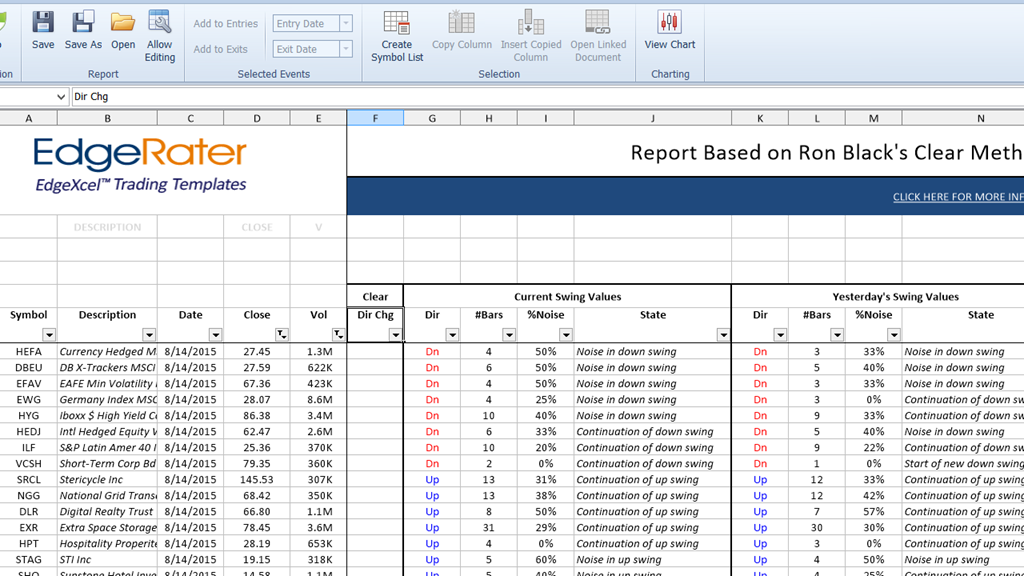
The first section of the report shows today’s and yesterday’s values
All columns are sortable and filterable and that is how you can quickly find stocks meeting your desired criteria in a mouse click or two.
Columns A through E are the usual columns you see in most EdgeRater reports, containing the symbol, Description, Date of Report, Close price and Volume.
Column F will contain a ‘Yes’ if the direction has changed today, or a blank if not.
Columns G through J show the current swing values based on the Clear Method:
- G: Current Swing Direction
- H: Number of bars in the current swing direction
- I: % of Noise Bars in the current swing direction
- J: Today’s state description. One of the following
- Start of new up swing
- Noise in up swing
- Continuation of up swing
- Start of new down swing
- Noise in down swing
- Continuation of down swing
Columns K through N repeat that information for Yesterday. The main benefit of this is when the swing direction changes today you can see the statistics for the previous swing. For instance if today’s state is “Start of new upswing” you can see how many bars were in the previous downswing and how much noise was in the downswing.
The next section of the report gives statistics for %Noise and %Clearing Bars over 7 different time periods:
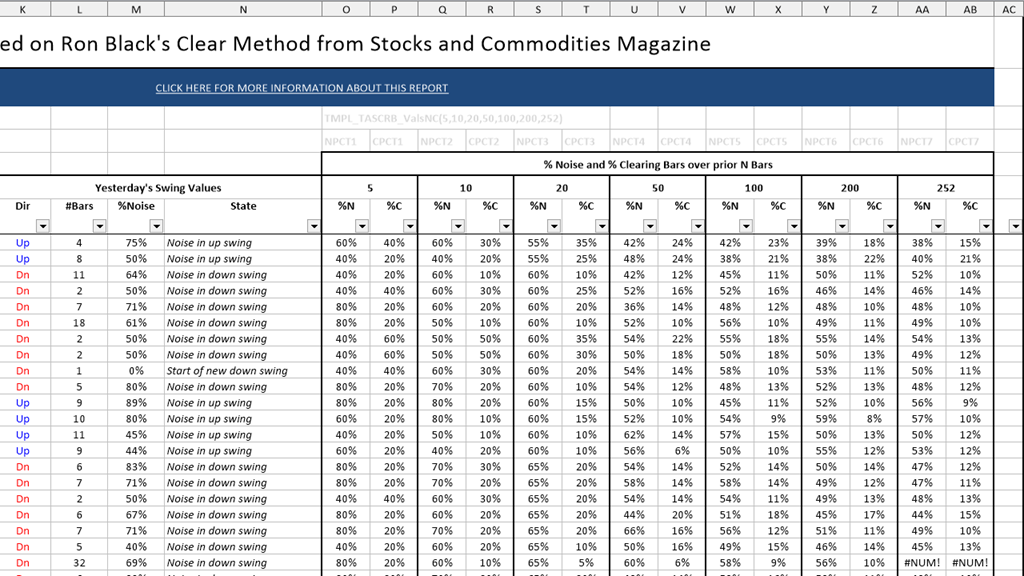
The second section of the report show the %Clearing Bar and %Noise Statistics
If you want to find stocks that have a low percentage of Noise bars over the last year, sort by column AA (252 trading days is one year).
Suggested Trading using the Clear Method
Ron Black has detailed in his article a way of applying the Clear Method to your trading. Use the articles in combination with EdgeRater to fully exploit this technique.
The Clear Method is not a trading method. The Clear Method detects the short term direction of prices, but it does not predict they will continue in any given direction. When the short term direction changes, this is a signal to check your charts and holdings and see if you want to make any entries or exits, because the prices are acting differently than they were before. It is a signal to make DISCRETIONARY decisions.
Summary
Ron Black’s Clear method uses a simple approach for detecting short term swings in a stock. A Stock can be in one of 3 states in an up swing: “Start of new up swing”, “Continuation of up swing” or “Noise in up swing” and the reverse states for a down swing. Different stocks have different amounts of noise. If the noise is currently a low percentage it implies the stock has been trending over that time period. Using the EdgeRater template you can easily see what stocks are meeting those criteria daily and also quickly view charts showing the Swing Line, Clearing Bars and Noise.
Take a free 30 day trial of EdgeRater (which includes this template and over 60 others).