
New Volatility
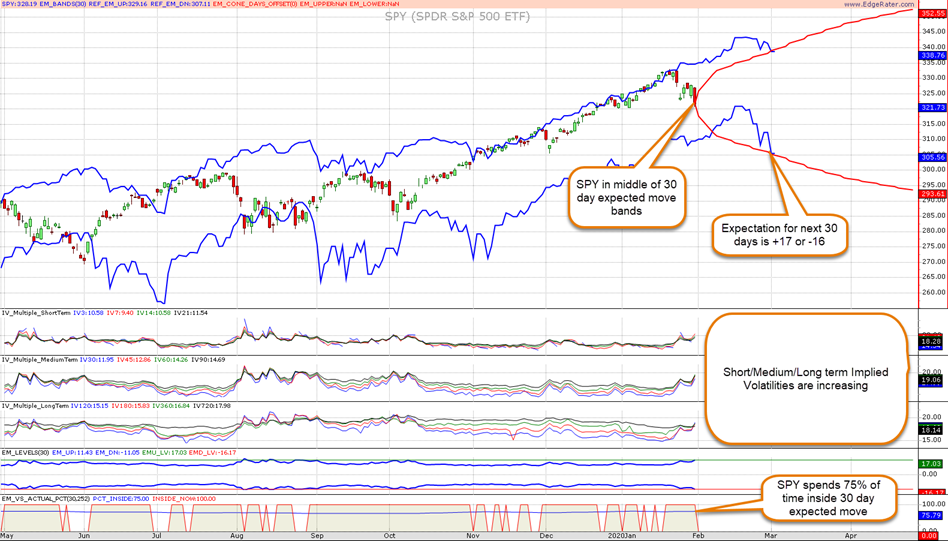
Last week was a volatile one in the markets compared to the recent low volatility environment we have been experiencing during the melt-up of the SPY index. As you can see from the above chart, SPY has been hugging the upper expected move band during the rally.
However, the prior 6 days have seen 2 strong down days followed by an attempted recovery and another strong down day. The current catalyst is the outbreak of the Coronavirus in Wuhan, China.
Despite the volatility, SPY is still well within the expected move predicted by the SPY options prices 30 days ago. This may be surprising considering there has been a 9.8 dollar move down (3%) in SPY over the recent 6 trading days.
During this volatile period options premiums and hence Implied Volatility numbers have increased. This has led to an expansion in the upcoming expected move bands. SPY spends about 75% of the time inside its 30 day expected move bands.
What to expect over the upcoming period
All short/medium and long term implied volatilities have increased and you can see the projected expected move in the above chart plotted as a cone projecting out from Friday’s close price. This chart is one of the new charts in EdgeRater and is available for SPY and all symbols that have weekly options associated with them.
Taking a fixed 30 day period you can see that options traders are expecting a +17 or -16 point move in SPY.
If you are not yet using the options implied volatility features of EdgeRater, now’s a great time to get into it and keep abreast of expected moves in the major indexes (ETFs) and your favorite stocks.
Have a great weekend,
Chris White
Founder and CEO, EdgeRater LLC
http://www.edgerater.com
PS. Take the free 14 day trial of EdgeRater to see what you are missing!