
 The March 2016 update to EdgeRater contains a couple of new features that make it really easy to browse information from all your favorite reports at one time and build a favorite stocks watch list while doing so.
This blog post explains the features and shows a couple of cool usage examples.
Multiple Synchronized Reports
A common scenario:
You regularly run your top 3 templates in EdgeRater and independently browse through the stock reports produced by the templates, viewing charts as you go and noting stocks of interest by writing them down on a piece of paper. You often cross-reference one report with another to verify certain conditions are fulfilled and you sometimes use the copy/paste column feature to get information from one report to another so that you can sort and filter by that column.
Now there’s a better way:
With the new synchronized reports feature, as you browse around one report all of the other open reports will scroll to bring the selected stock into view.
A real-world example:
You are looking for stocks that are moving higher in a tight linear regression channel and are trading near the lower rising channel line and that have good upcoming seasonality. As you find stocks of interest you also want to know other stocks that are correlated to your chosen stock.
How to achieve this:
- Run the following 3 templates:
- Linear Regression SD Channel Analysis
- Annual Trends – Now
- Correlation Matrix
- Position the 3 reports produced by the templates so that you can view them at the same time
- Start using the reports in the way you always have, sorting and filtering and viewing charts
- Note that all reports are kept in sync
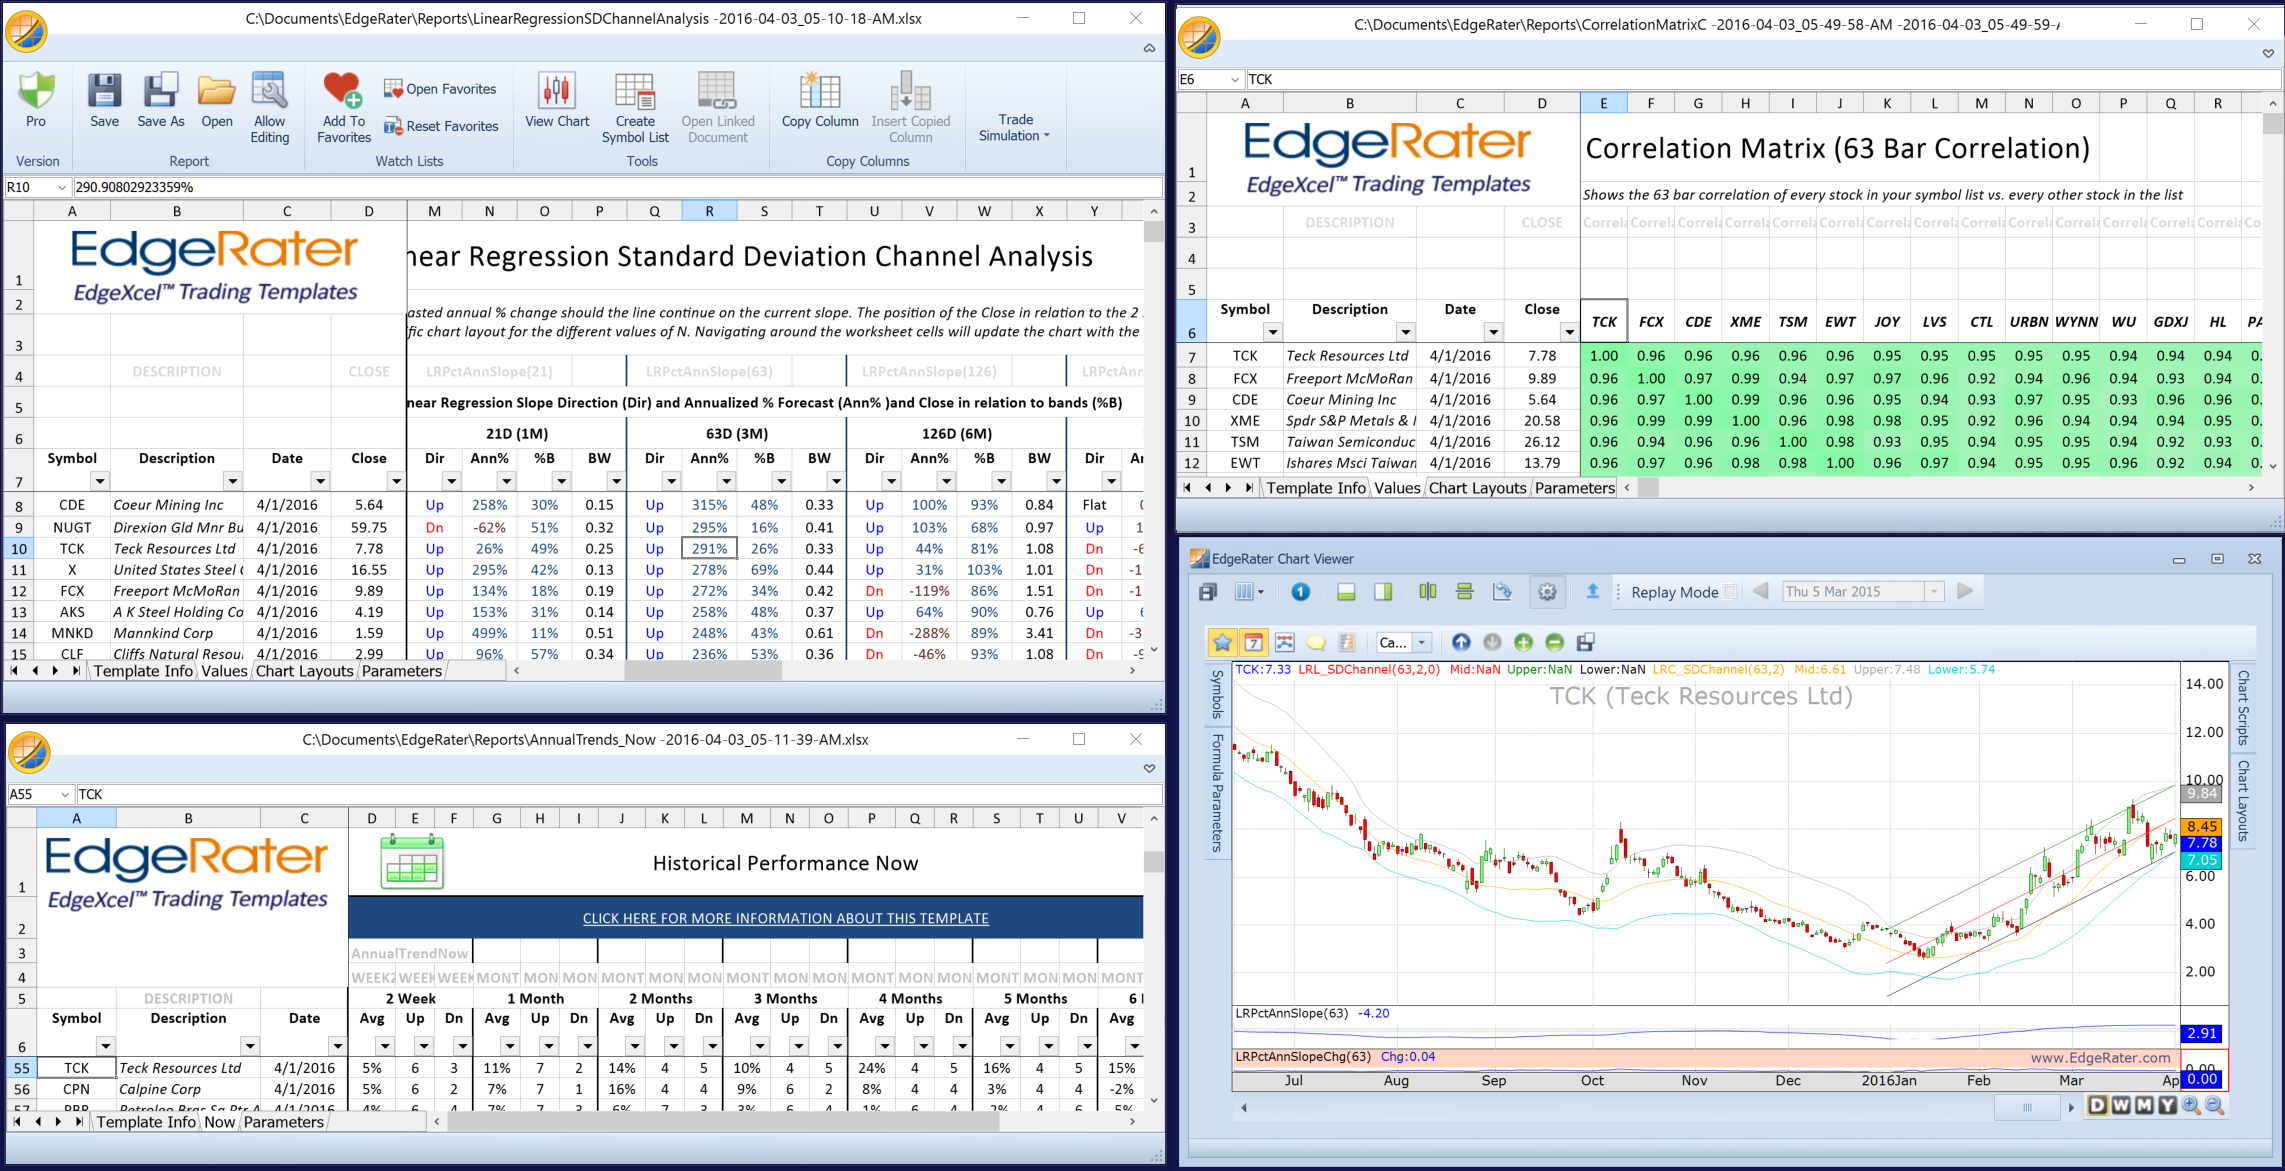
Multiple Synchronized Reports and Chart
In the above screen shot, I have selected TCK from the Linear Regression Channel Standard Deviation Analysis report (upper left). As I did so, the Seasonality report (lower left) and Correlation Matrix (upper right) automatically scrolled TCK into view and also the chart updated with the chart layout defined by the Linear regression template.
From this one view of multiple synchronized reports I can immediately see that TCK is in rising 63 day linear regression channel, has upcoming seasonality of 11% gain in one month (7 up years, 2 down years) and is closely correlated over the 63 day period with FCX, CDE, XME, TSM, EWT.
Favorites Watch List
As I browse around the various reports produced from EdgeRater templates I can now easily add stocks of interest to a favorites watch list. Continuing the above example, if I think that TCK is interesting I can just click the Add To Favorites button:
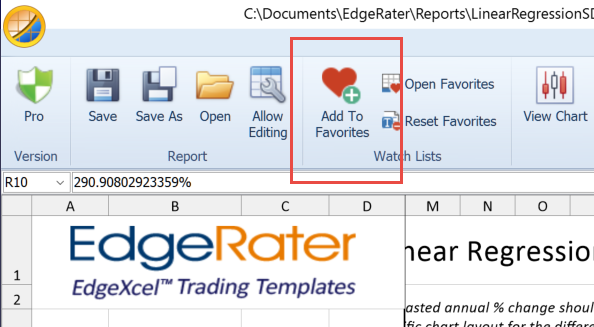
Add To Favorites Button
The stock will then be added to the end of the Favorites Watch List:
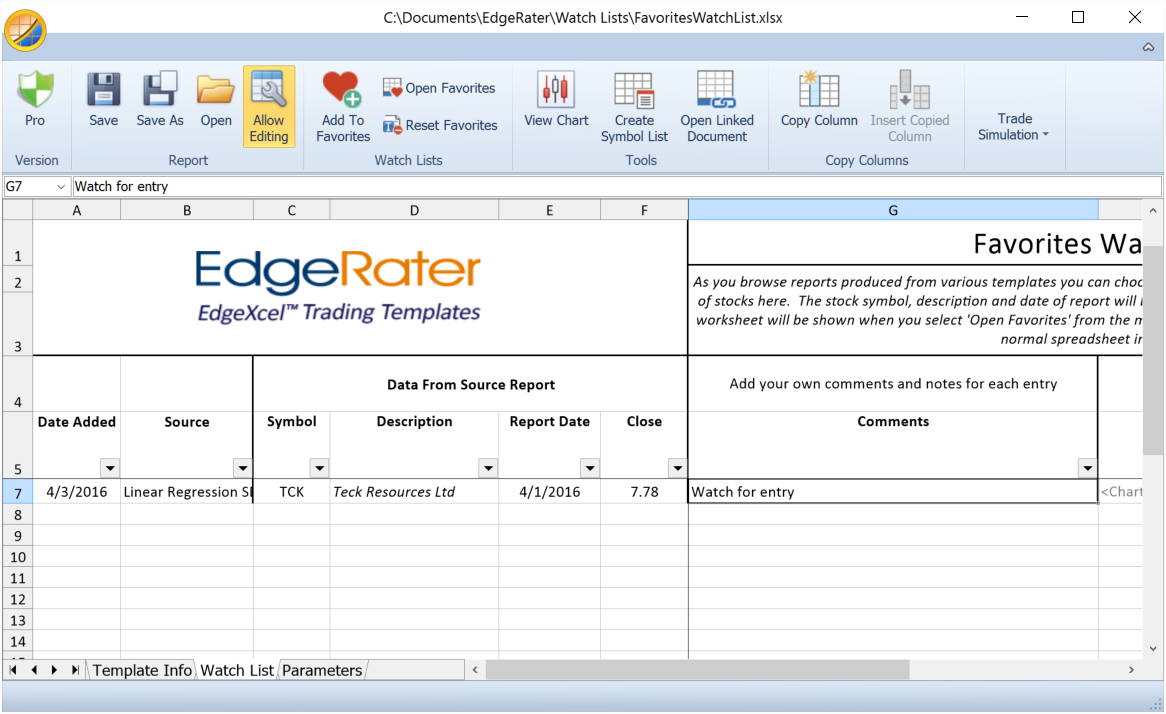
Favorites Watch List
The comments cell will be selected so that I can add extra notes that will remind me when looking through the watch list in the future.
Note that information about the source report is automatically added to the watch list. The Source column is populated with the name of the source report (in this case it’s the Linear Regression report). The date FOR which the report was run is added along with the date ON which the report was run (these can be different if viewing old reports or running the templates for historical dates). A link back to the source report is added so that when looking at the favorites watch list in the future you can highlight the row and press Open Linked Report to view the original report. Also the current chart layout is added so that it can be re-displayed when looking at the watch list in the future.
It’s also possible to manually type in any symbol to create your own favorite even if it the stock is not part of any report.
There is only one current ‘Favorites’ watch list but it is possible to Save As a different filename in case you want to have a permanent record of the state of the list at any point in time.
Using the Favorties Watch List at a future date
So, now your favorites watch list is full of useful stocks and personal notes, how do you use it in the future?
Just select ‘Open Favorites’ from the EdgeRater menu and the watch list will be displayed. It acts just like any other report in that whenever you select any row, the chart will be updated to show the stock and annotated to point to the report date. Any other open reports will also sync to show that stock. Also if ‘Linking’ is turned on the chart layout will be modified to match the layout of the saved favorite.
Summary
Two new features in EdgeRater, ‘Synchronized Reports’ and ‘Favorites Watch List’ make it super easy to find and remember stocks that meet your criteria. ‘Synchronized Reports’ keeps all open reports scrolled to the currently selected stock allowing you to see your preferred information. The Favorites Watch List allows you to save and make notes about any stock and review them at a later time, always keeping track of the date that you made the note and the report that it came from.
Now there’s no excuse to ever miss a move in stock that you have been stalking.