
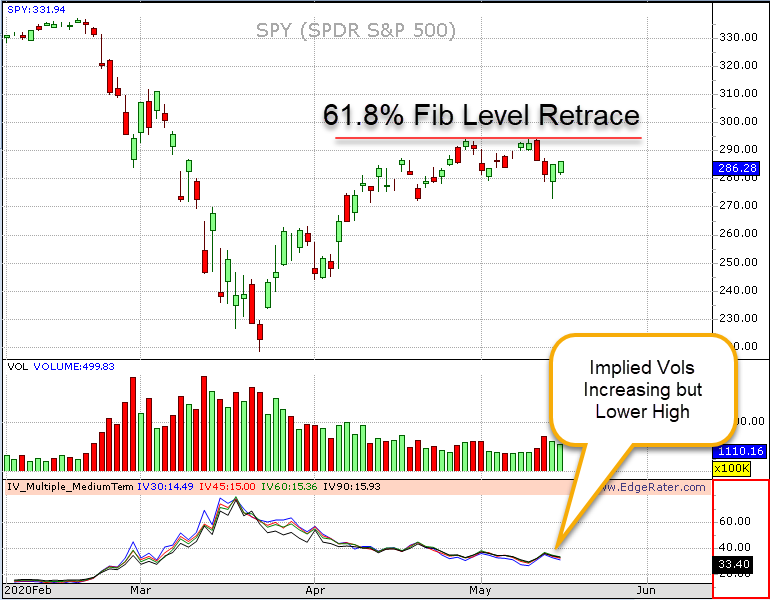
This week in the SPY we saw a loss of 2.1% after hitting the 61.8% Fib retrace level of around 294.12. The high for SPY on Tuesday was 294.24.
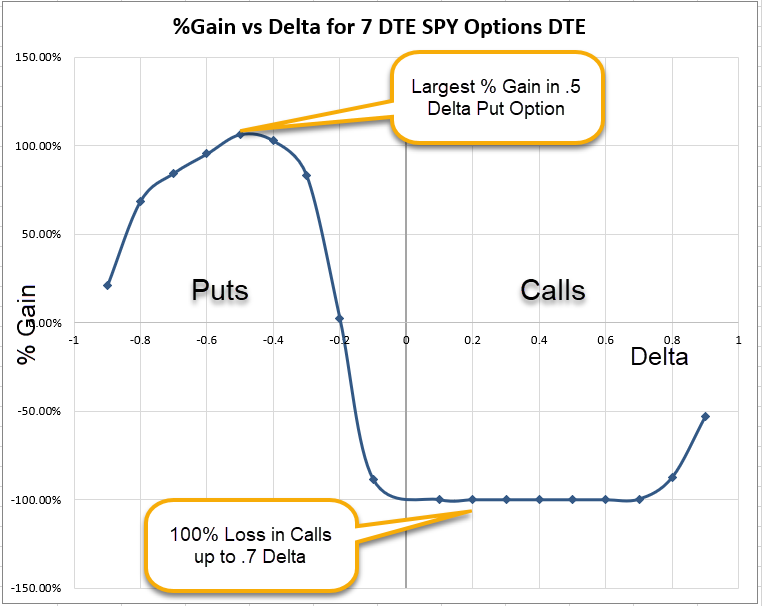
In the 7 DTE option chain the biggest %gain was observed in the -.5 delta put option, with a 106% gain. 100% loss was seen in the .1 through .7 delta calls
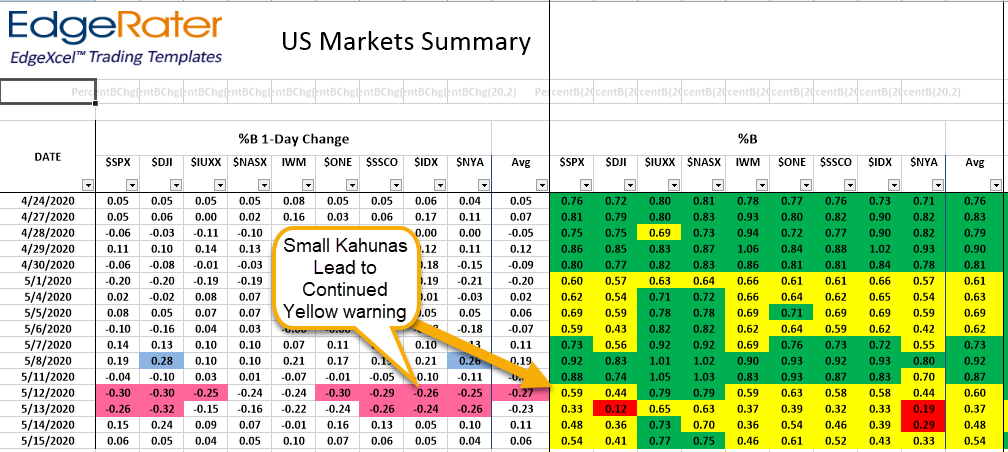
The US Market summary saw small kahuna signals (%B 1 day change down .24 or more) across multiple markets. Taking the %B levels back into mixed condition (Yellow/Green). The DJI and NYSE Composite even entered the red zone.
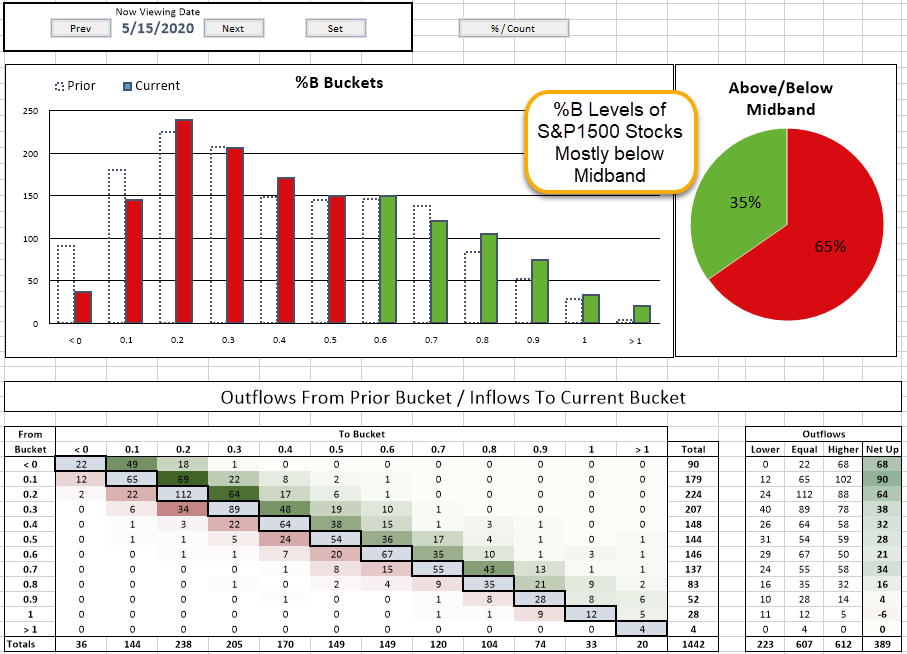
The % B Bucket Migration report shows 65% of stocks below their mid Bollinger band. A sign of weakness.
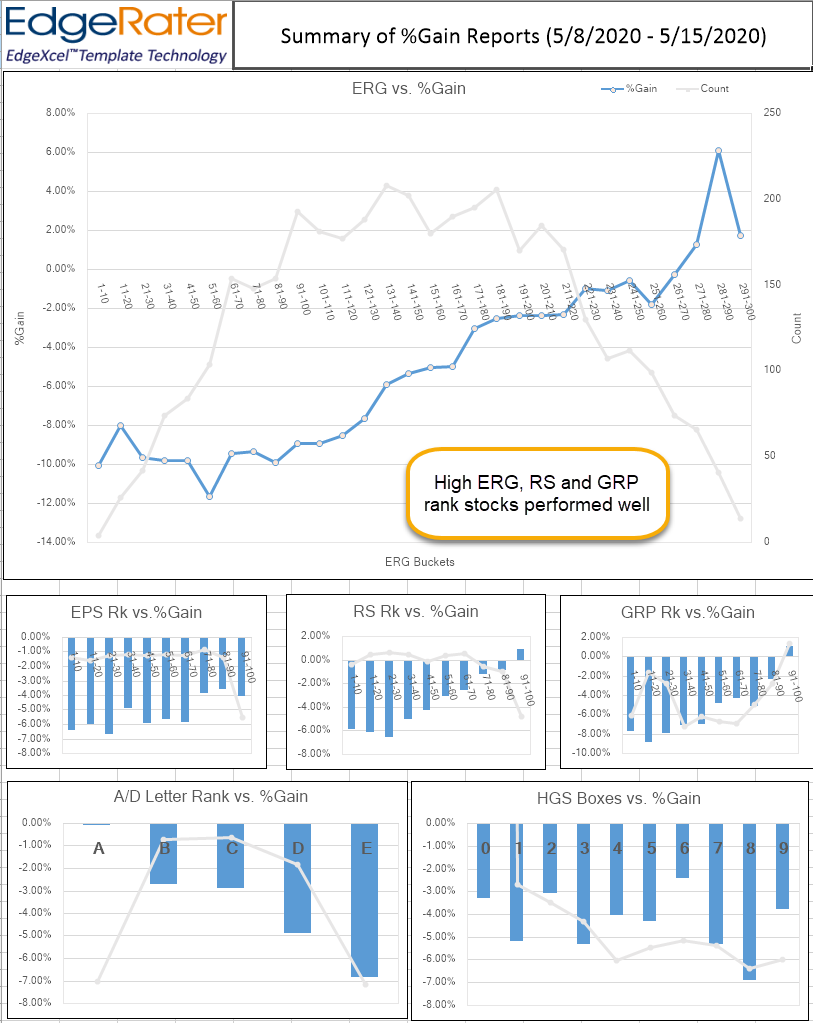
In a week where the SPY was down 2.1%, low ranked stocks were down even more. There were pockets of out-performance (even gains) in the highest ranked stocks.
Summary
As indicated last week, the 61.8% fibonacci retracement level proved to be a major resistance level. SPY hit the level almost on the nose before selling off Tuesday/Wednesday and Thursday morning before an attempted recovery starting late Thursday morning through end of Friday. The market is now in a more fragile condition than last week and the 61.8% level needs to be taken out before more advances can be made. If this is a bear market rally then we could be witnessing the peak right now. As always, watch the %B levels, and US Market summary to see early signs of strength or weakness.