
Volume Price Analysis
Volume Price Analysis (VPA) is a term coined by Anna Coulling and described in her trading book “A Complete Guide to Volume Price Analysis”. It is similar in concept to Volume Spread Analysis (VSA) which is a term coined by Tom Williams of TradeGuider. Both VPA and VSA are based on the works of Richard Wyckoff, Charles Dow and Jesse Livermore, traders famous in the 1920s.
The idea behind VPA is to uncover supply and demand in any stock using volume in combination with price and spread (the difference between Open and Close).
Recommended reading:
The book explains in detail the concepts and ideas behind VPA and is recommended reading for anyone interested in the topic.
The EdgeRater VPA Signals Template
The EdgeRater VPA template can be run against any list of tickers and produces a report which shows the current VPA signal as well as the long, medium and immediate trends.

The EdgeRater VPA Report
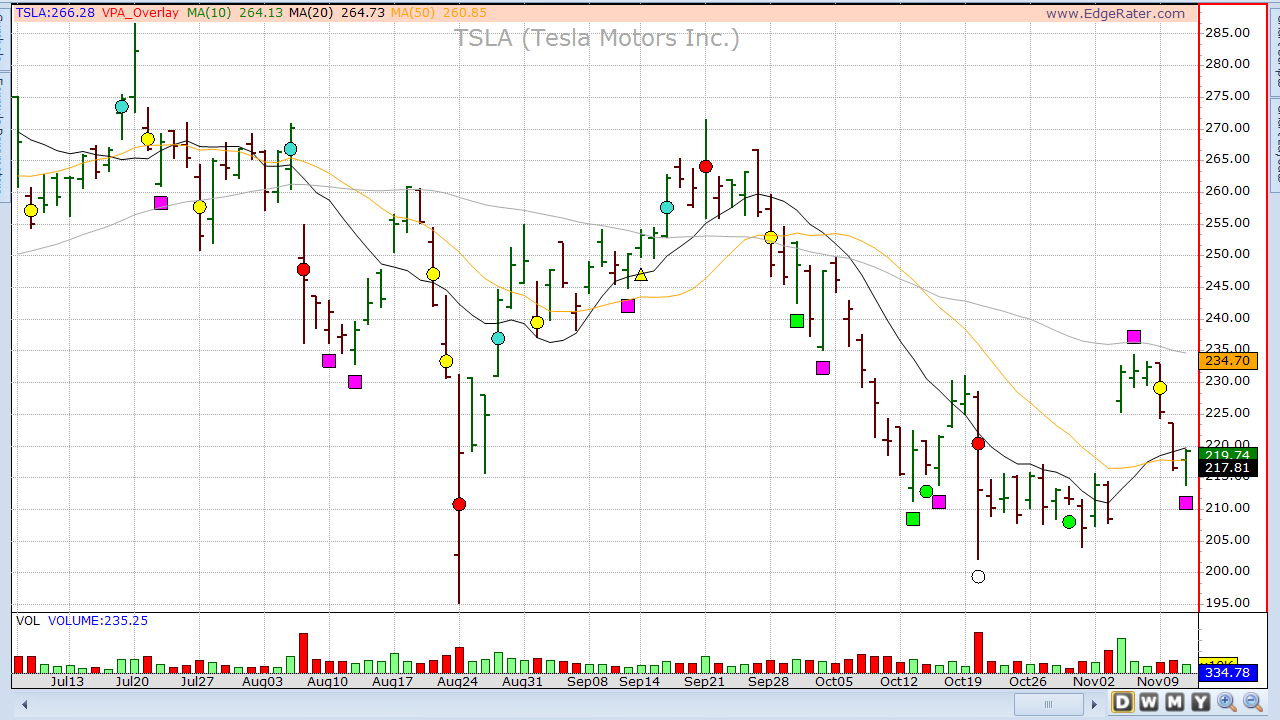
The EdgeRater VPA Chart Overlay
There is a new chart indicator that can be found in the indicator library called VPA_Overlay. You can drag this overlay on top of the current price chart to see the VPA Signals.
The report is linked to the VPA chart so that you can see the current and historical signals superimposed on the price. The signals are indicated by various colored shapes that appear above, below and mid bar:
The VPA Symbols
| Symbol | Color and type | Relative Bar Placement | Meaning |
 |
Lime Circle | Below | No Supply. A sign of strength |
 |
White Circle | Below | Stopping Volume. Normally indicates end of bearishness is nearing |
 |
Aqua Triangle Up |
Below | High Volume Upbar following a low volume bar in a downtrend. Closing near the high. Indicates strength |
 |
Lime Triangle up |
Below | An Upbar closing near High. Confirms return of strength |
 |
Yellow triangle up |
Below | An Upbar closing near High after a test confirms strength |
 |
Lime Square |
Below | Test for supply. A sign of strength |
 |
Magenta square | Below | Low volume test for supply. |
 |
Yellow square |
Below | Reverse upthrust. Indicates strength. |
 |
Blue Circle |
Above | Wide range bar closing down on heavy volume after touching the high of the last 10 bars . Bearish. A rare signal |
 |
Blue Square |
Above | Psuedo upthrust. A sign of weakness |
 |
Blue Triangle Down |
Above | A downbar closing down after a pseudo upthrust confirms weakness |
 |
Lime Triangle Down |
Above | Wide range bar closing down on heavy volume after making new short term highs . Bearish. A rare signal |
 |
Yellow Triangle Down | Above | High volume downbar after an upmove on high volume indicates weakness |
 |
Red Triangle Down |
Above | An upthrust bar. A sign of weakness |
 |
DarkRed diamond |
Above | Potential buying climax |
 |
Magenta square |
Above | No demand. A sign of weakness |
 |
White Square |
Above | An Upthrust Bar after upmove. A Sure sign of weakness |
 |
Red Circle |
Mid | Transfer of ownership |
 |
Turquoise Circle |
Mid | Effort to rise. Bullish sign |
 |
Yellow Circle |
Mid | Effort to fall. Bearish sign |